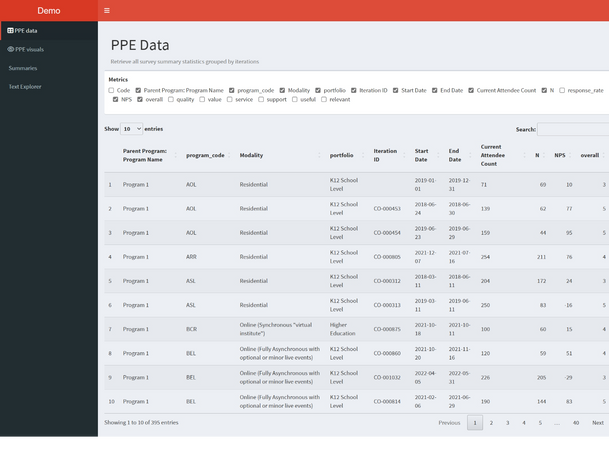
HGSE PPE Data Dashboard
Date: 2022
Location: Cambridge, MA
Roles: Data Analyst & R Developer
Organization: HGSE Professional Education
The Problem
Harvard Graduate School of Education offers hundreds of continuing education programs to the global education community through its Professional Education arm. The team had been collecting course evaluation data using Qualtrics for the past few years. The data was locked up in a format inaccessible for exploration and analysis.

My Role
I joined the team as a quantitative analyst while pursuing my master's degree in education at Harvard. The project allowed me to hone quantitative skills while also developing familiarity with the US higher education system and adult learning.
The Requirement
Over a couple of workshops with the evaluations team, I discovered that while the project was ostensibly analytical, the team needed a product solution that:
-
Aggregate thousands of Qualtrics surveys and conduct cross-survey descriptive analysis.
-
Allowed for convenient text-mining of open-ended questions.
-
Served as a single source of truth for program summary data.
I developed a lightweight data pipeline with R and Google Cloud as a low-cost, fast-turnaround solution. Raw survey responses are pulled from Qualtrics, cleaned and merged in Google Sheets, and piped to a Shiny Dashboard for exploratory analysis. The web application supported:
-
Real-time exploratory data analysis of Qualtrics data in R
-
Interactive pivot data analysis
-
Text analysis of open-ended survey responses
The Learning
-
Interactive data exploration with R Shiny
-
Working with Qualtrics and Google Cloud APIs in R
-
Text-mining with Bag-of-Words in R


